|
Prosticks Articles
蘋果日報 --- 七月二十三日
制訂套利策略增勝算
最令散戶頭痛的,通常不外乎兩件事 -
幾時該止蝕?幾時該獲利沽出?今天
本欄要討論的,是如何利用聚焦點來制定套利策略。
獲利不是一件容易的事,如果說正確地套利比準確地預測大市更重要,亦不為過。假使沒有一個適當的套利策略,只讓利潤留在帳面,可能遇上市場又轉向,就會變成「紙上富貴」。而另一方面,如果能及時套利離場,即使估錯市,也仍然有真正的利潤。
很可惜,大部分投資者花太多時間在何時入場,而不去思考何時離場,結果即使他們預測正確,不是太早套利嬴少了,就是太遲套利又輸出去。適當的獲利策略,需要小心制訂及遵守。
借聚焦點尋找支持
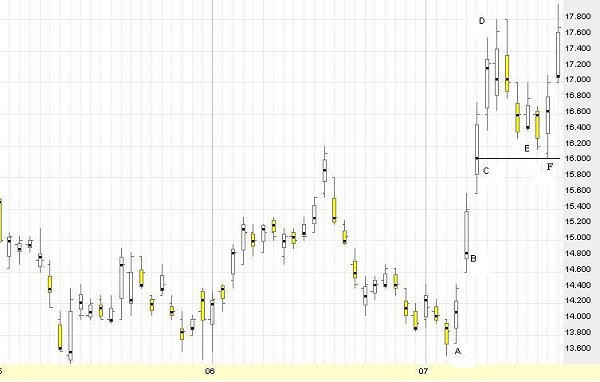
九倉(004)
上圖是九倉(004)的乾坤燭圖,如何利用聚焦點來找出獲利沽貨位?假設精明的你在A位買了九倉,一個星期內,它從13.5元彈升到17.8元(圖中D位),接近30%利潤,僅僅一星期。很明確的升勢下,當然沒有理由急於套利逃跑,但通常強烈反彈之後,會進入調整階段,在D之後的幾天,股價從17.8元跌到E日的16.5元的。
在E日,你可能開始猶豫,該繼續持有還是沽出了事?如果現在沽出,仍有20%利潤,不算太差,不過,中線仍然看升,萬一沽了再升,豈不是失敗?該怎樣做?
我們已經知道聚焦點是支持位及阻力位所在,正如傳統智慧所言,當一個支持(阻力)位被衝破時,價位會跌(升)到下一個支持(阻力)位。即是說,當一個重要聚焦點被跌破時,價位會跌到下一個重要聚焦點。
定止賺位鎖定利潤
再看乾坤燭圖,A、B、C及D是主要聚焦點,因為它們都是長燭身及裂口上升,代表強勁的購買力,特別是在交投集中的聚焦點價位。
當價位從D調整到E時,我們擔心利潤繼續被侵蝕,要定下一個止賺位。可以用C的聚焦點價位(16.05元)作止賺位,保護既得利潤,因為如果跌破C的聚焦點價位,價位將會跌到B的聚焦點價位,找尋支持。
可以見到,調整的確在F日結束,低位正好是C的聚焦點價位。如果你的經紀驚訝地問你是否有魔法時,你會怎樣答?
(有關乾坤燭之連載可於乾坤燭網站 www.prosticks.com 內觀看)
|