|
Prosticks Articles
蘋果日報 --- 八月十三日
活躍區可避圖表陷阱
在股票市場,無論你是初哥還是老手,都容易跌入某些圖表陷阱。例如股價上升衝破重要阻力位,你買入之後,才發覺原來摸了頂;或者看到股價跌低過所有重要支持位,你只能現價止蝕,然後,更令你感到沮喪的事發生了,當你止蝕後,它卻升回來。這類挫折,在投資者的買賣生涯中,一再發生,令人感到圖表陷阱已經成為不可避免的市場現象,只有接受。
有時,圖表陷阱是大戶有意製造出來的,由於大部分散戶依照類似的買賣方法和策略,大戶很容易操縱短期價位,令圖表出現相應模式,來引誘散戶。例如,某大戶手上有大量貨想派出街,知道你會在上破阻力位後買入,他可以掃高股價至破位,引散戶追入,他則趁此機會沽貨。
另一個人所周知的詭計是在下午3:30後,堆積大量買盤,然後掃上高位收市,令它成為當日十大升幅之一。散戶以為買盤強勁,在第二天開市後必然搶貨,大戶則開始派貨給你,你搶得愈瘋狂,他沽得愈開心。
短線而言,個別價位是大戶操縱的目標,若看圖只看個別價位,很難避開潛在的走勢陷阱。
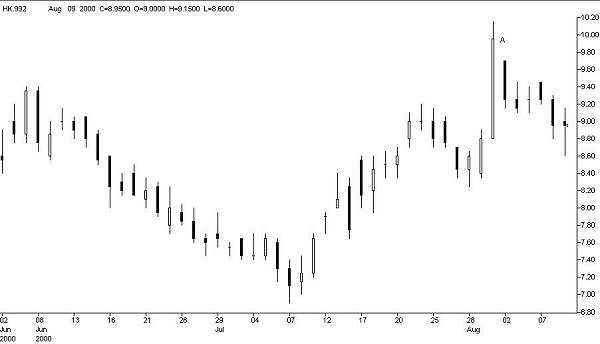
下圖是聯想(992)的陰陽燭圖,燭A是一支大陽燭,衝破近期阻力位,但股價在第二天開始下跌,明顯地是個技術陷阱。
聯想集團(992)
代價昂貴 大戶難操控
聯想集團(992)
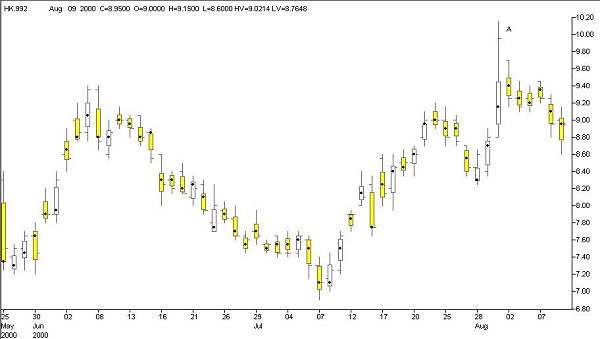
但上圖聯想的乾坤燭圖中可以看到,雖然A日升勢強勁,以全日高位收市,活躍區實際上位於燭身的下半部,說明大部分買賣是在當日低位成交,急升並無成交量配合。若了解到這一點,散戶不應在A搶入。
活躍區與聚焦量不同於個別價位,很難被操縱,因為它們是成交聚集的地方,操縱它們要付出昂貴金錢,而操縱個別價位則花費不多,尤其是市場安靜的時候。活躍區是市場活動了最長時間及交易量最大的一段價格範圍,理論上,它覆蓋了當天交易總量的
68%,它是從頻率分布圖中用中值偏差法演算出來的。你若有興趣知道其方程式,請到乾坤燭網站
www.prosticks.com
一遊。
|