|
Prosticks Articles
蘋果日報 --- 九月十七日
聚焦量可窺好淡力量
上星期談過聚焦量概念,及用在觀察好淡雙方力量對比的價值。聚焦量是市場花在聚焦點的時間總和,如果聚焦量愈高,說明好淡雙方在聚焦點價位的爭持愈激烈,當其中一方感到疲累的時候,市場就會向另一個方向突破。
附圖為匯豐( 005)乾坤燭圖,下方是聚焦量,在A處,股價見過116元的高位後進入調整,大約一個星期內已跌到109元。留意圓圈位置4支燭B至E,它們全部受制於A的聚焦點阻力,表示在A的聚焦點價位,沽售壓力相當大。
儘管B及C的最高位在A的聚焦點之上,它們的活躍區是在A的聚焦點之下,即是說,當日市場的交易大部分都是在A的聚焦點之下價位進行,都受制於此價位;至於燭D和E,它們的最高位同A的聚焦點一致,再次印證了強烈的沽售壓力存在於此價位。
再看B至D,它們的聚焦點全部在同一價位,另外,C及D的聚焦量很高,高過附近的所有燭及 150日平均數。好淡雙方在這3天的激烈鬥爭,集中在同一個價位。此外,由於它們的活躍區全都受制於A聚焦點,可以推測,在這3天中,市場控制權已經慢慢被沽方掌握,沽方力量比買方強。
量高反映爭持激烈
在E日,聚焦量顯著下跌,低過 150天平均數,這代表在B至D這3天的激烈鬥爭之後,其中一方已經取得控制權,市場不再需要在聚焦點花大量時間,所以聚焦量很小。至於是哪一方佔領了市場,E燭已經很清楚地表現出,沽方是嬴的一方,價位在接近最低位收市,聚焦點亦低過之前的3天,再加上活躍區也比之前3日低。
留意F的聚焦點,落在G和H組成的聚焦點平台上,在E處佔上風的淡友,在F的聚焦點處,與好友再次交戰。極高的聚焦量顯示好淡雙方爭持激烈,誰是嬴家?若單從F燭來辨別,由於F燭身軀很短,無法透露太多的資訊,然而,由於聚焦量的數值極高,價位一定會朝其中一邊突破,因此需要等待下一天,見升就追入,見跌就追沽。由圖可見,翌日在聚焦點位開市,以接近全日低位收市,沽方是嬴家。
由上述例子可見,通過比較聚焦量的高低,可以對比好淡雙方的力量,誰嬴得這場角力賽,嬴得容易還是困難。這些資料,結合聚焦點及活躍區的分布,可以洞悉市場的動向。
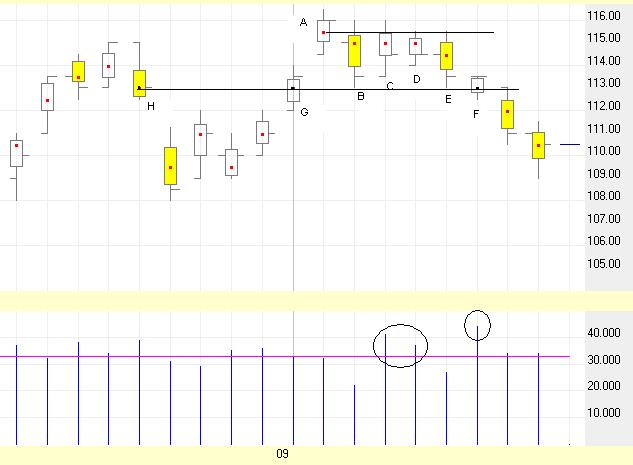
匯豐控股(005)
|