|
Prosticks Articles
蘋果日報 --- 十月八日
黃金比率測市神奇
在技術分析中,經常會用到 0.382、0.5、0.618這組數字,稱為黃金分割比率或神奇數字,最初古埃及人使用這組數字來建金字塔。
Elliot是第一個將這組數字用於預測股價的人,他發明的波浪理論也是依賴這組數字來辨認波浪循環的不同階段。
簡單來說,在上升趨勢中,當價位出現較大調整時,回調的位置通常止於整個升幅的38.2%、50%或61.8%;相反地,在跌浪中,如果出現明顯的反彈,反彈的終點通常也是整個跌幅的38.2%、50%或61.8%。
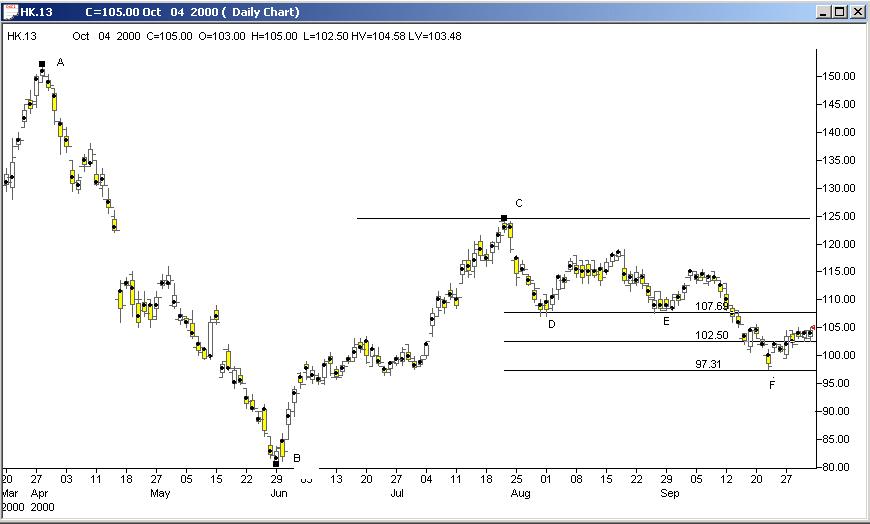
和記黃埔(013)
上圖是和黃 (013)的陰陽燭圖,股價在A跌到B後,反彈到A-B的61.8%(圖中C)
,然後再跌。同樣地,在從B升到C後,調整到D及E,即B-C的38.2%,然後股
價略升之後再跌到F,而F正是B-C的61.8%。此類現象在任何市場及任何股票
上,重複出現,一再證明神奇數字的神奇。
配合聚焦點更有效
然而關於這些神奇數字,卻有兩個難題。首先,如何預知會是哪一個比率?其次用黃金比率來作預測,需要找出主要的高低位作計算,究竟用哪個高低位卻比較主觀。
下圖為東亞 (023)乾坤燭圖,股價從A升到B後,回吐50%到C,然後反彈B-C跌幅的61.8%,去到D,之後再跌到E,正是A-B的61.8%。
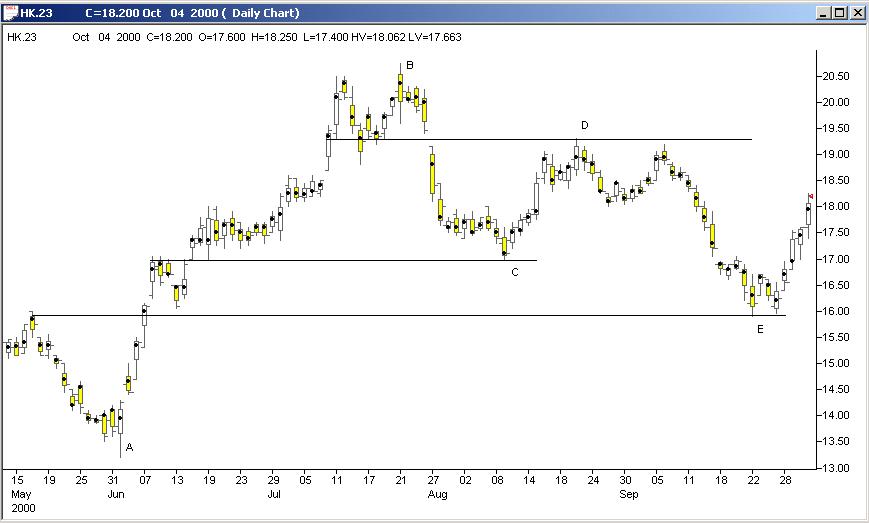
東亞銀行(023)
我們可以利用乾坤燭來幫助增加黃金分割位置的準確度,如下圖中, C、D、E
不僅是黃金分割的位置,也是之前一些聚焦點或聚焦點平台,構成雙支持或阻力,即是說,如果既是黃金分割的位置,又是聚焦點平台價位的話,這一個黃金分割比率更有效。
不過,這種雙重支持或阻力,並不等於牢不可破,要留心觀望及利用 RSI、STC等其他技術指標的訊號,來判斷市勢的動向。
|