|
Prosticks Articles
信報 --- 九月四日
單邊市前的沉寂
上周本欄用乾坤燭的聚焦點趨勢線,講述了澳元兌美元已跌破重要支持,今周將繼續跟進澳元兌美元的走勢,以及可以採取的應對策略。
從澳元兌美元的乾坤燭圖看,L1包含了四個聚焦點,是一條強力有效的支持線(圖)。當價位跌破此支持線後,翌日更出現插水式急挫(A燭)。但請留意,隨後數日,價位在
0.568-0.576徘徊,沒有走出A燭的範圍,見圖中用圓圈圈出的位置,儘管這幾支燭的高低位曾經超越A燭的活躍區,但它們的活躍區全部都包含在A燭的活躍區之內。
這種情形究竟有什麼啟示呢?
活躍區是當天成交最活躍的價格範圍,當天大約68%的成交在此價格範圍內進行,即是買方和賣方在當天交易環境下一致同意的價格範圍,從經濟學的角度而言,這是「市場均衡價格」。
在往後幾天,活躍區全部都包含在A燭的活躍區內,這種現象顯示市場正處於非常平衡的位置,人人都同意A燭的活躍區是一個公平交易範圍,沒有投資者願在活躍區外買賣。極端的市場平衡表示市場正等待某些重要消息的發放,或者買方及賣方都對市場的方向缺乏信心,不願在平衡區外主動進攻。過於平衡的市場,其實是暴風雨來臨的先兆,單邊市即將展開。
雖然投資者難以猜測單邊市的方向,但仍可準備兩件事,方案一是做馬鞍式或勒束式期權長倉,不論朝哪一個方向突破,都可以有利潤可圖。但缺點是若突破的幅度不大或突破不到,便將損失期權金;方案二是等到正式突破才採取行動,在A燭的活躍區之上追買,或在A燭的活躍區之下追沽。但為了避開走勢陷阱,應該等當日的活躍區或聚焦點都突破A燭的活躍區範圍,才算正式突破。
(有關乾坤燭的連載可在乾坤燭網站 www.prosticks.com 內觀看)
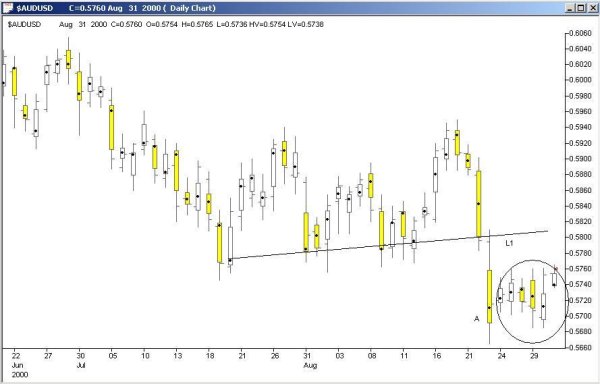
澳元兌美元乾坤燭走勢
(2000年6月21日-8月31日)
|