|
Prosticks Articles
信報 --- 九月十八日
捕捉轉勢反彈知易行難
對於趨勢線的運用,有兩派學說,一派主力追隨趨勢,就以支持線為例,當價位跌穿支持線,該派信徒將馬上追沽,經常閱讀本欄的讀者,便知道筆者是該派信徒。
另一派致力捕捉轉勢反彈或調整,該派追隨者認為價位跌至支持線附近,買入博反彈極具值博率,問題關鍵是如何界定離開支持線多近買入呢?事實上,這段距離很難客觀界定,有投資者以百分率界定,如以 2%為分水嶺,跌至高於支持位2%買入,跌穿支持位2%止蝕;但為何是2%,而不是1%或3%呢?分野並不客觀。
美元兌日圓日線圖看, L1為連接主要底位A及B的支持線,可以看到當價位再次跌近支持線C點,支持線發生效用,其後一周內出現了幅度300點以上的反彈(圖一)。
利用趨勢線捕捉轉勢反彈的支持者,相信自己一定可以把握這次買入機會,但知易行難,因為C點= 104.57,但當日最低位卻是104.75,故此如等待104.74至104.57間入貨,將錯失良機,最困難的是,如何得知最低價不到104.57,而只跌至104.75?
若利用乾坤燭聚焦點圖,則可輕易處理這難題,趨勢線 L2並非以最低點相連,而是以連貫A及B聚焦點而成(圖二),可以看到聚焦點C剛好觸及趨勢線L2,證明支持線發生作用,有大量買盤在該水平湧至,投資者就算錯失當日低位買入的機會,看罷圖表,仍可把握機會在翌日上車,藉此反彈圖利。
(有關乾坤燭連載可於乾坤燭網站
www.prosticks.com 內觀看)
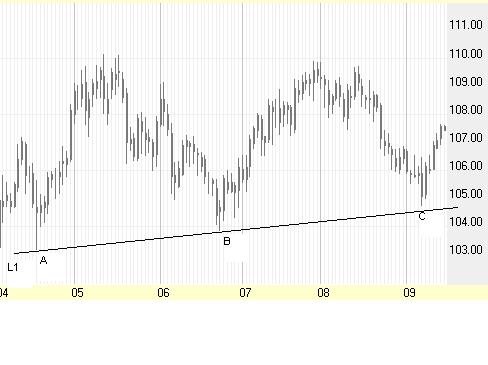
圖一 美元兌日圓日線圖
(2000年4月3日
- 9月15日)
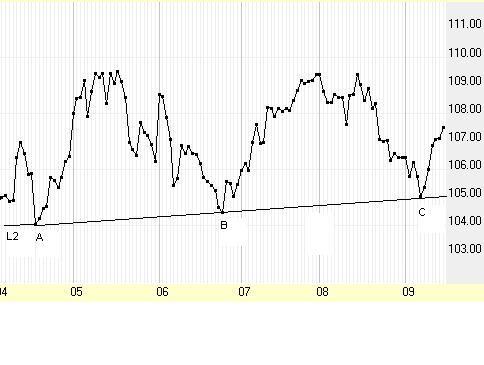
圖二 美元兌日圓乾坤燭聚焦點圖
(2000年4月3日
- 9月15日)
|