|
Prosticks Articles
信報 --- 十月二十三日
以聚焦點定出入市時間
用乾坤燭圖分析,A是一支很長的陽燭,說明它的聚焦點價位有很強的購買力存在(圖一),該聚焦點價位的重要性不可小覷;而且與燭B的聚焦點價位剛好一致,組成聚焦點平台。
用圓圈圈出的幾日價位回落,正好測試此聚焦點平台,結果活躍區全部在平台之上。
看來,此平台的確有良好支持。如果想買入英鎊,可以把止蝕位設在此處,當活躍區或聚焦點跌破此平台價位時,平好倉離場。
此外,也可以用趨勢線方法來確定何時買入。從英鎊聚焦點線圖看,用C及D的聚焦點劃出阻力線L1(圖二),假使某日聚焦點升破此線則買入。再看回圖一,若用傳統方法,用最高點劃出阻力線L2。很明顯,用L1可以比L2更早入市,買得更便宜。
若比較圖一及圖二,可以看到乾坤燭圖比較詳細,紀錄了更多資料;圖二則簡單明瞭,撇開一些干擾。兩者各有所長。在乾坤燭網站,可以快捷方便地隨意交替使用這兩種圖。
(有關乾坤燭連載可在乾坤燭網站
www.prosticks.com 內觀看)
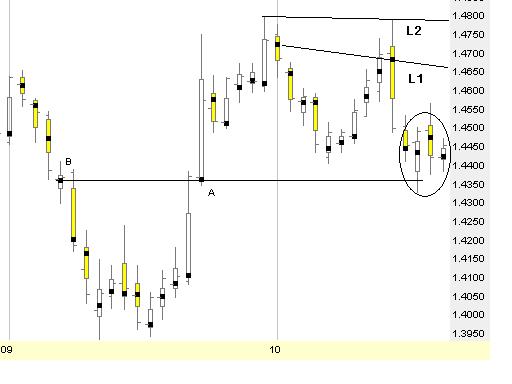
圖一 英鎊兌美元乾坤燭圖
(2000年9月1日
- 10月20日)
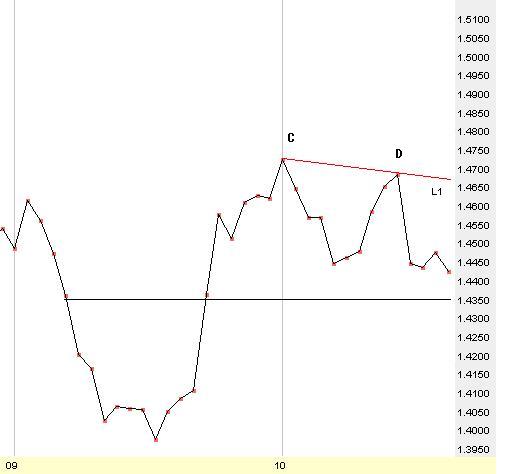
圖二 英鎊兌美元聚焦點線圖
(2000年9月1日
- 10月20日)
|